
Categories
Selling / BuyingPublished August 25, 2026
End of Summer NATIONAL Market Review

To give context to what is happening locally, it helps to look at the broader landscape first. Below is a breakdown of recent national economic and housing metrics, along with what each data point means for buyers, sellers, and overall housing market momentum on the ground.
Mortgage Rates
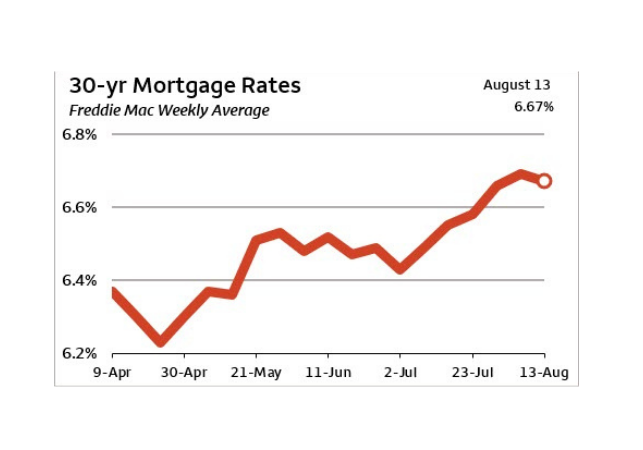
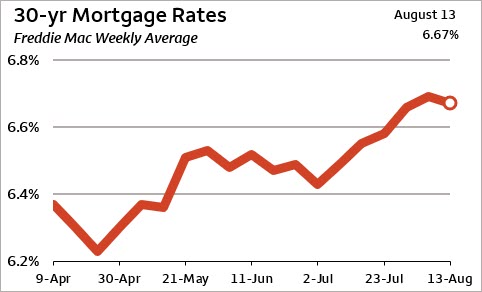
Freddie Mac’s 30-year fixed-rate conforming mortgage benchmark dipped slightly to 6.67% for the week ending August 13. While down two basis points from the prior week’s late-July high, borrowing costs remain elevated. Rates averaged 6.52% in July, 6.49% in June, and 6.32% over the trailing 52 weeks—ranging from a low of 5.98% in late February to current levels.
- What this means for the housing market: Mortgage rates hovering in the mid-to-high 6% range keep buyer purchasing power constrained. Until borrowing costs catch a sustained downward trend, many buyers will remain cautious, reducing overall market speed and pushing affordability strategies—like seller-paid rate buydowns—front and center.
Existing Home Sales Volume
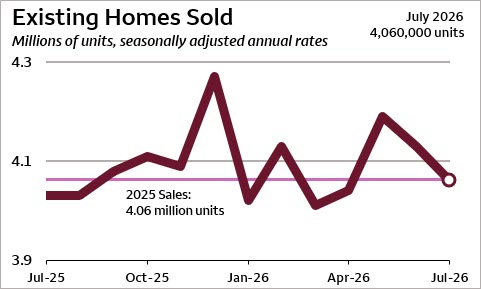
Existing home sales pulled back for the second straight month in July, decreasing 1.7% to an annualized pace of 4.06 million units. Despite the recent monthly slowdown, year-to-date transaction volume remains up 2.4% compared to the first seven months of 2025.
- What this means for the housing market: Buyer activity is cooling off nationally as high rates take a bite out of demand. Sellers can no longer expect instant, multiple-offer bidding wars simply by sticking a sign in the yard; proper pricing and proactive marketing are once again essential to close a deal.
Inventory and Market Pacing
The median time on market for existing homes rose to 29 days in July, edging up from 28 days a year earlier. Available inventory stood at 1.54 million units at the end of the month, representing a minor 0.6% decline from July 2025 levels.
- What this means for the housing market: Homes are taking slightly longer to sell, giving buyers time to breathe, schedule inspections, and think through their decisions rather than rushing to make panic offers. It signals a shift toward a more balanced, less frantic market environment.
Headline Inflation (CPI)
The Consumer Price Index (CPI) rose a modest 0.1% in July, bringing the 12-month headline inflation rate down to 3.4% from 3.5% in June. Annualized inflation over the three-month period ending in July cooled to a 0.5% pace.
- What this means for the housing market: Slower inflation is good news for the long-term health of real estate. As general price pressures ease, it builds a stronger case for the Federal Reserve to eventually lower baseline interest rates, which would ultimately bring relief to mortgage rates.
Core Inflation (Core CPI)
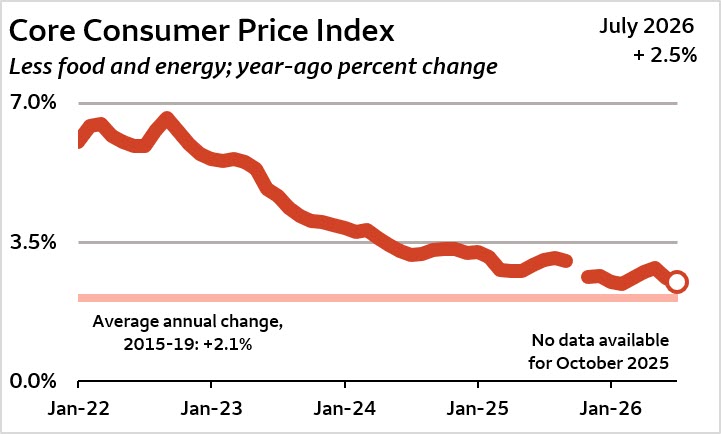
Core CPI, which removes volatile food and energy costs, increased 0.2% in July, bringing its year-over-year rate down to 2.5% from 2.6% in June. This 2.5% reading matches the lowest 12-month rate since March 2021, moving closer toward the 2.1% annual average seen between 2015 and 2019.
- What this means for the housing market: Falling core inflation shows that underlying economic noise is settling down. A stable economic baseline helps build consumer confidence, reassuring buyers that household expenses are stabilizing even as housing costs remain sticky.
Wholesale Inflation (PPI)
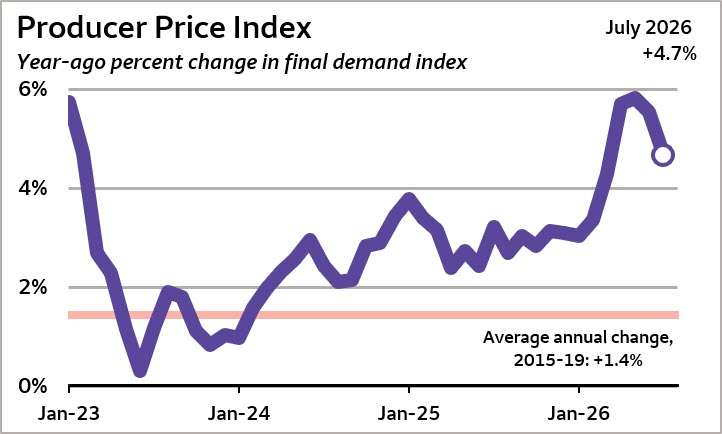
The Producer Price Index (PPI) held flat in July compared to June. This flat reading pushed the year-over-year wholesale inflation rate down to 4.7%, continuing a steady deceleration from 5.5% in June and a peak of 5.8% in May. For context, annual PPI growth averaged 1.4% from 2015 to 2019.
- What this means for the housing market: Flat wholesale prices ease the cost burden on builders and suppliers. Over time, controlling production costs helps stabilize new construction pricing and repair costs, which benefits both buyers of new homes and sellers completing pre-listing improvements.
Nonfarm Payrolls
Labor market data showed unexpected contraction, with nonfarm payrolls falling by 23,000 jobs in July alongside sharp downward revisions to prior months. Combined job gains for May and June were cut from a previously reported 186,000 down to just 83,000. Over the past 12 months, monthly payroll gains have averaged 26,300 jobs—well below the 2015–2019 baseline average of 190,500 jobs per month.
- What this means for the housing market: A softening job market introduces uncertainty, leading some potential buyers to put major life decisions on hold. However, weak labor data often puts downward pressure on bond yields, which can indirectly lead to lower mortgage rates.
Unemployment & Labor Force Trends
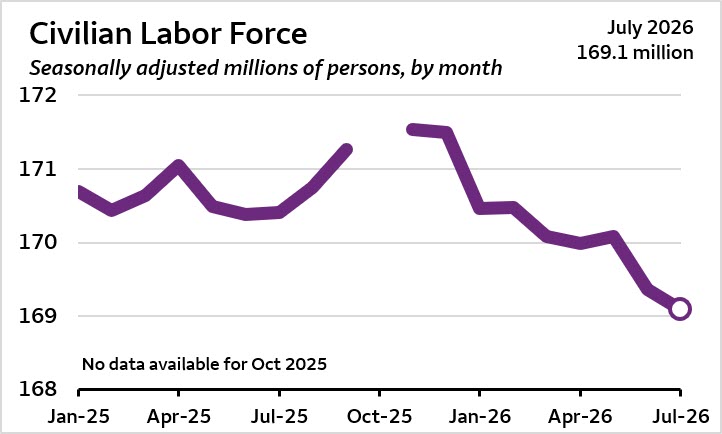
The headline unemployment rate dropped from 4.2% in June to 4.1% in July, marking its lowest point since mid-2025. However, this dip reflects shrinking participation rather than job growth: total employment fell by 87,000, while the overall labor force shrank by 264,000 workers in July (and by 984,000 workers over the last two months combined).
- What this means for the housing market: While a low headline unemployment number usually sounds positive, the contraction in the active workforce signals underlying economic hesitation. It reinforces that market growth won't be driven by a speculative buying surge, but rather by necessity-based moves (relocations, family changes, life events).
Consumer Credit Expansion
Total non-mortgage consumer credit expanded by 2.4% over the 12-month period ending in June, accelerating slightly from 2.1% in May. While consumer debt growth is picking up, it remains well below the pre-pandemic average annual growth rate of 4.8% recorded from 2015 through 2019.
- What this means for the housing market: Moderate consumer debt growth means buyers aren't overleveraging themselves on credit cards and auto loans as heavily as in past years. This keeps their debt-to-income (DTI) ratios healthier when applying for a home loan, though strict underwriting standards still apply.
10-Year Treasury Yields
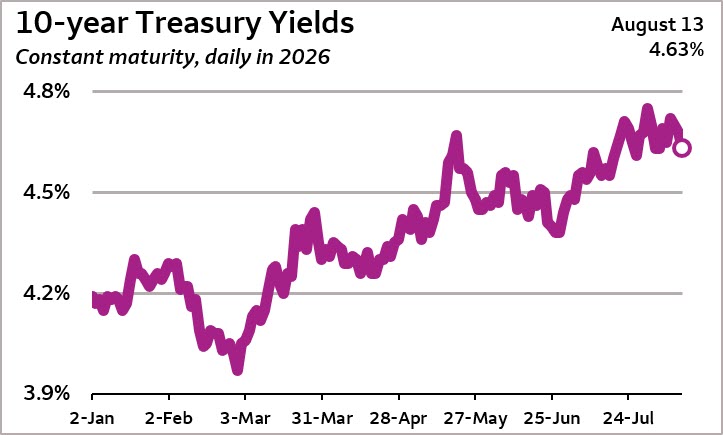
The 10-year Treasury yield registered at 4.63% on Thursday, August 13, pulling back after touching a high of 4.75% on July 31. Yields averaged 4.60% across July and 4.47% in June, maintaining a higher path compared to the 52-week average of 4.28% and the 52-week low of 3.97%.
- What this means for the housing market: Mortgage rates move almost hand-in-hand with 10-Year Treasury yields. Because yields remain firmly elevated above 4.5%, home buyers should expect mortgage rates to stay higher for longer rather than banking on a rapid rate drop in the immediate future.
#US mortgage rates #August 2026 #housing market #inventory trends #CPI #inflation #real estate impact #home buyer #negotiating power.

Jeff Chenore
Broker/Owner CMV Realty | Chenore Group | CMV Realty LLC
or another way